
Description
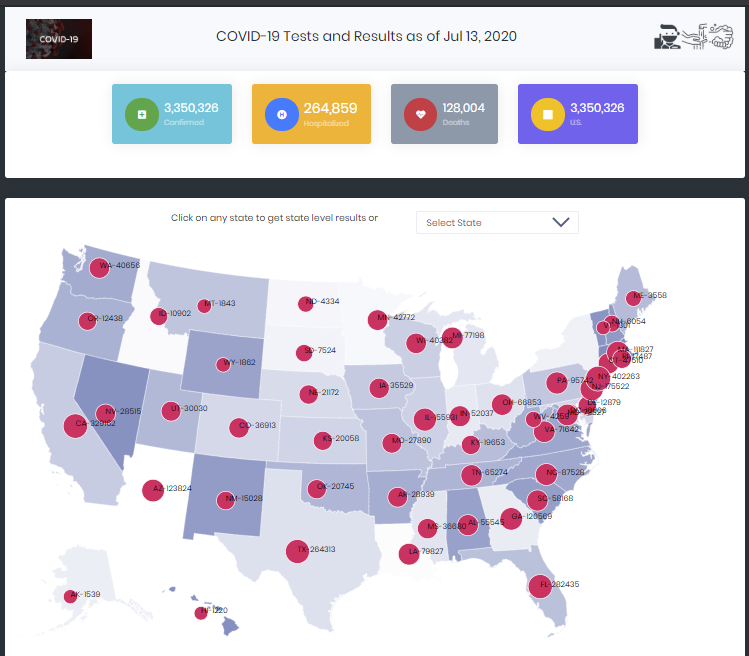
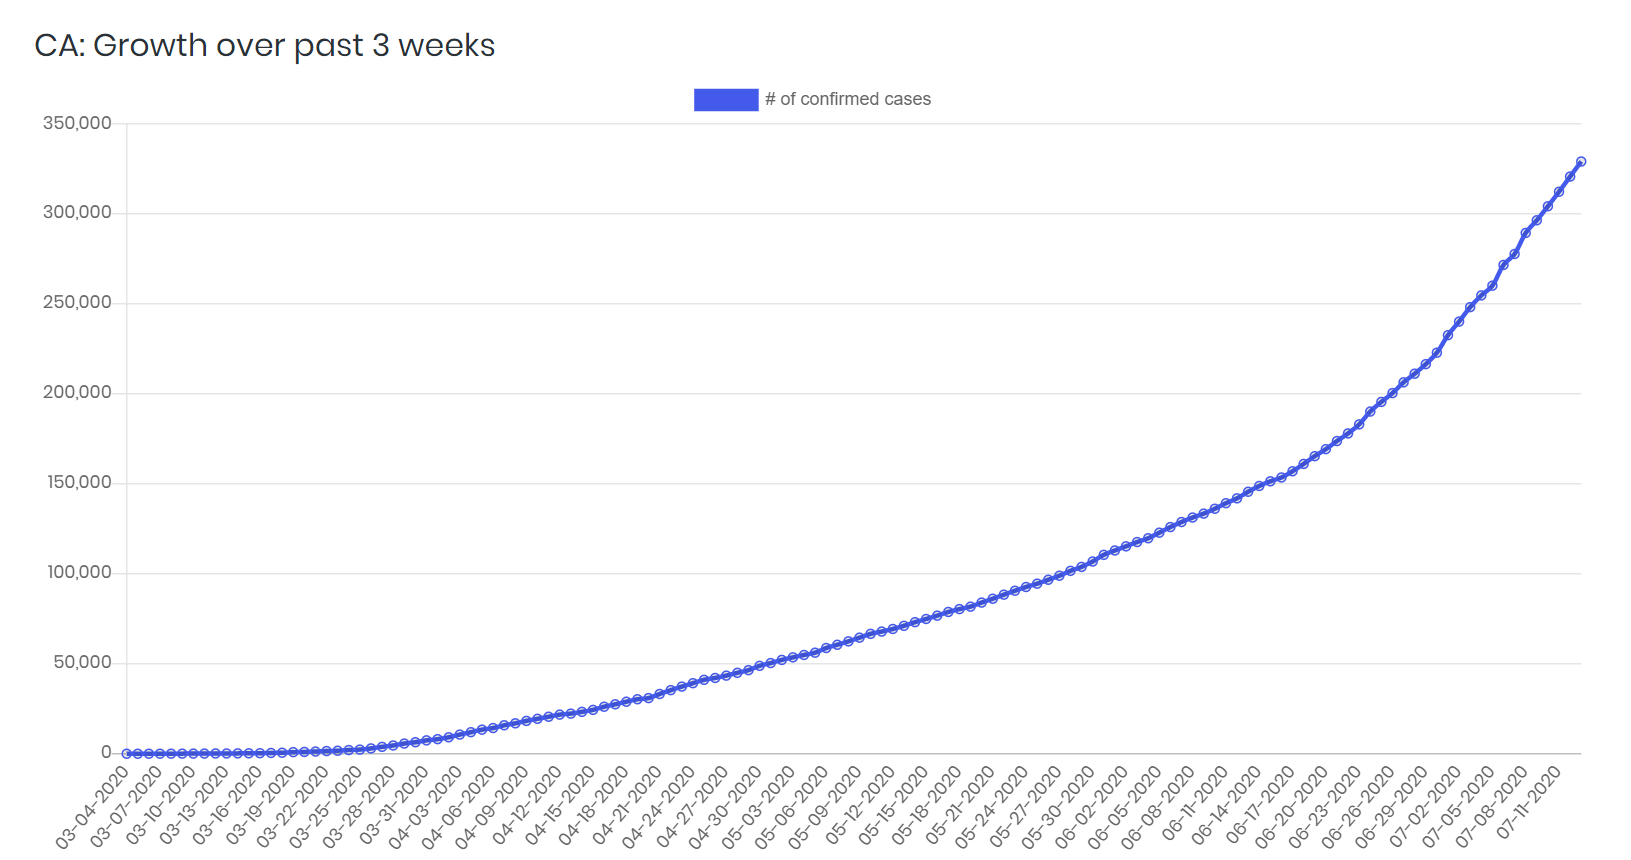
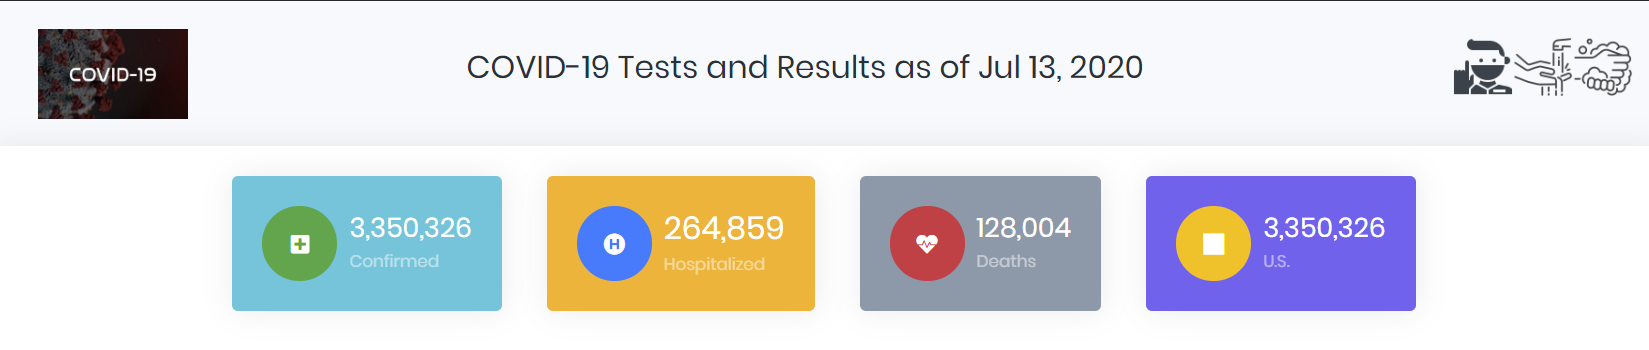
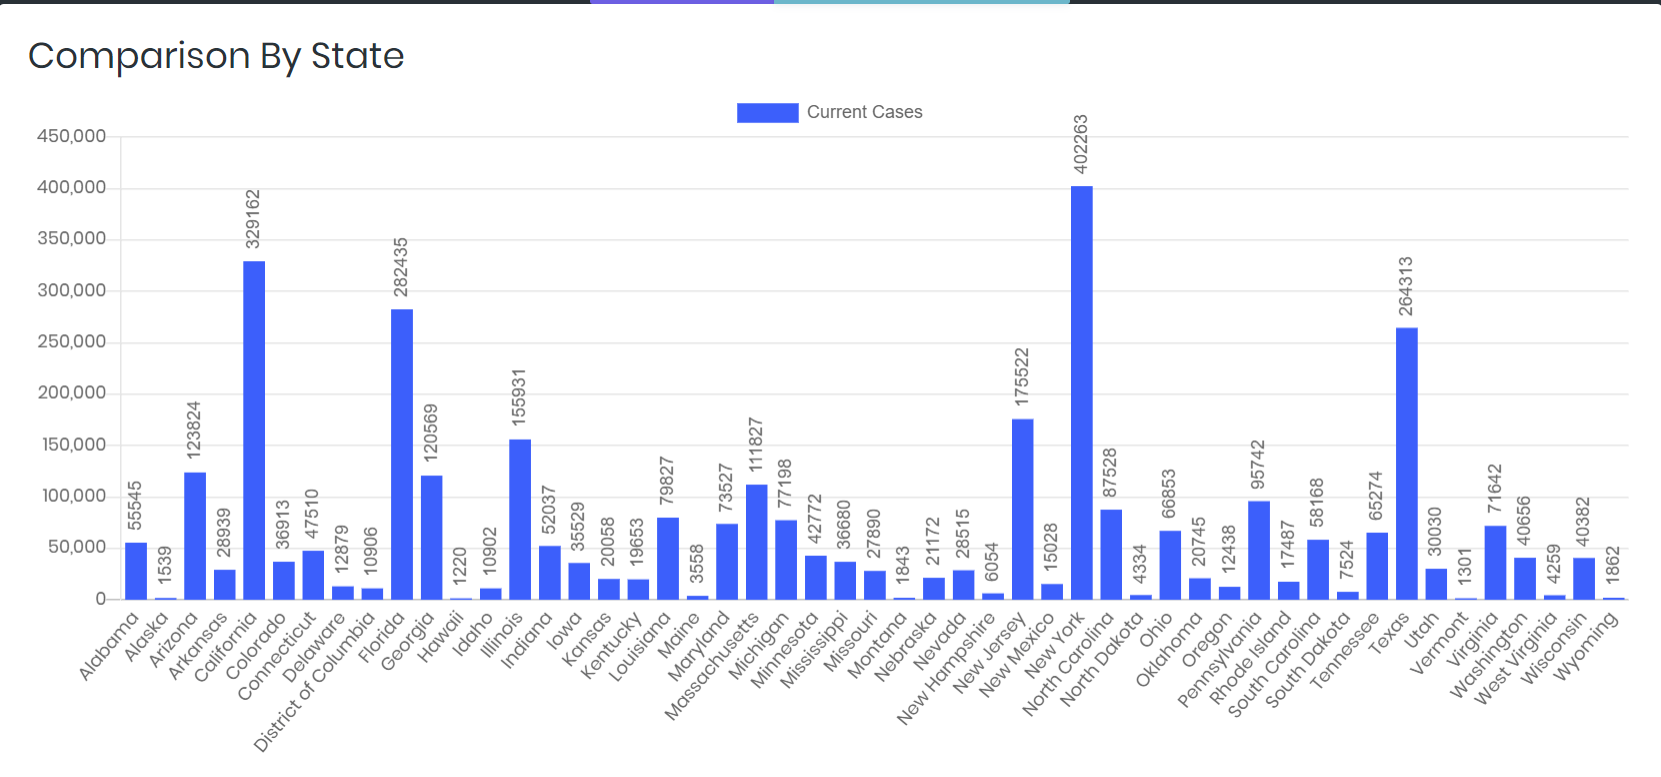
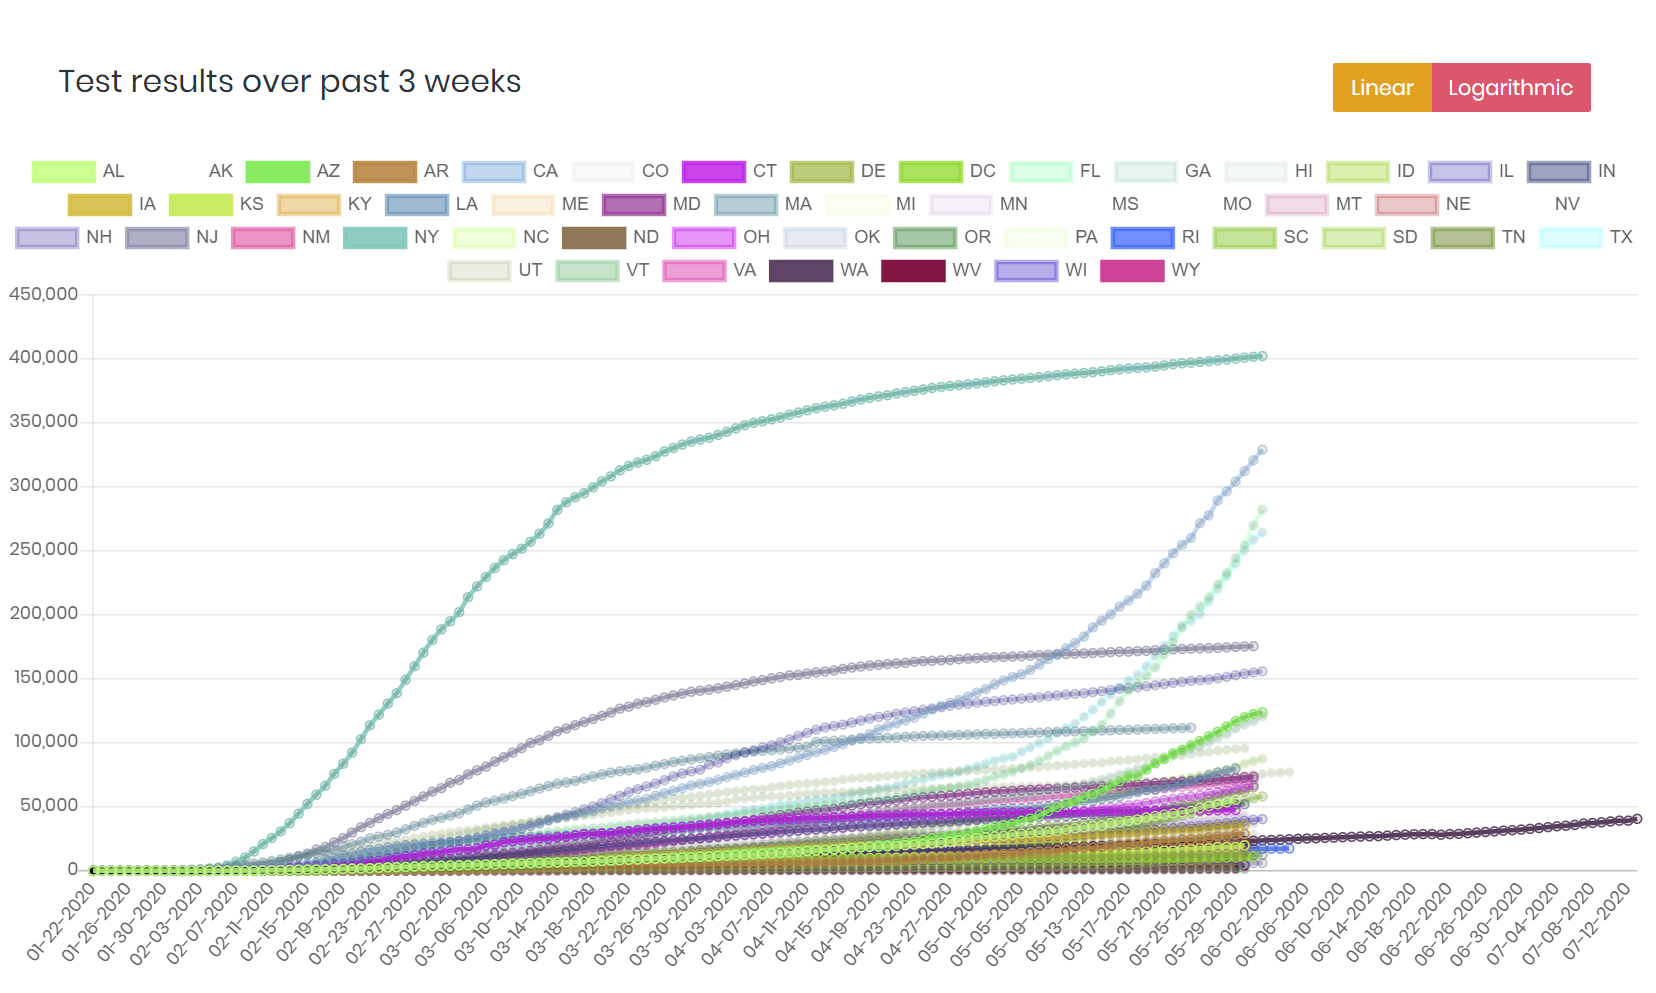
Gathers real time statistics on Covid-19 cases in the U.S and the world and displays on map and as graphs.
Technologies used
- 3rd Party APIs: Backend software to gather statistics
- JavaScript and React framework: Frontend UI
- D3 charts and D3-Geo: Data visualization software
- GitHub